-
Learning by doing
-
Trainers with practical experience
-
Classroom training
-
Detailed course material
-
Clear content description
-
Tailormade content possible
-
Training that proceeds
-
Small groups
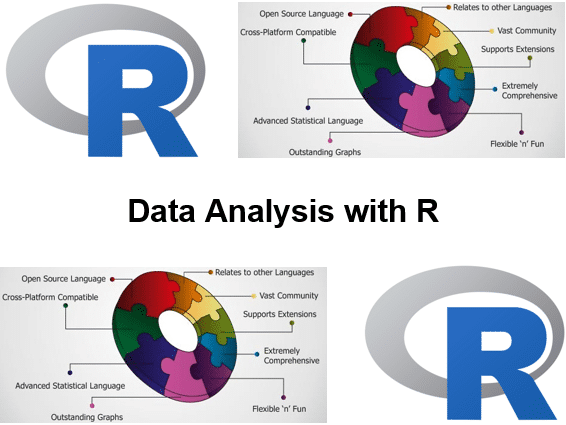
In the course Data Analysis with R you will learn programming in the R language and how you can use R for data analysis and visualization. R has become a standard platform for data analysis and data visualization and can perform a huge range of statistical procedures. In the course Data Analysis with R a series of coherent R packages are used, known as the tidyverse. These packages share an underlying design philosophy, grammar and data structures and are especially suitable for data science.
The course Data Analysis with R starts with the installation of R and the R Studio development environment. The basic syntax of R and the installation of R packages are also discussed.
Next you will learn how you can quickly gain insight into the data with the ggplot2 package by means of plots. The different plot types, themes and layouts are discussed as well.
Then it is time for the dplyr package with which common data transformation problems such as filtering, sorting, summation and grouping can be solved.
Presenting data with the rmarkdown package is also covered. As well as tidying raw data with the tidyr package, where columns become variables and rows become observations.
Time series occur in many data sets. The processing of these time series is addressed with the lubridate package that has many useful functions for processing dates and time.
Part of the course program is also the import of data from CSV files and file formats from other statistical packages such as SPSS or SAS. Reading from and writing to databases is also treated.
Finally the course Data Analysis with R deals with statistical analysis models such as linear and non-linear models, variable transformations and regressions. All this is supported with many practical examples and can also be applied to cases that are brought along by the students.
The course Data Analysis with R is intended for Big Data analysts and scientists who want to use R to analyze their data and to make static analyzes.
Experience with programming is beneficial to good understanding but is not required.
The theory is discussed on the basis of presentations and examples. The concepts are explained with demos. Then there is time ample to practice with it yourself. R-Studio is used as a development environment. Course times are from 9:30 am to 16:30 pm
After successful completion of the course the participants receive an official certificate R Programming.
Module 1 : Intro R |
Module 2 : Graphics and Plots |
Module 3 : Transformations |
|
Overview of R History of R Installing R The R Community R Development R Studio R Console R Style Using R Packages Cheatsheets R Syntax R Objects |
ggplot2 Graphics Devices and Colors High-Level Graphics Functions Low-Level Graphics Functions Graphical Parameters Controlling the Layout Changing Plot Types Quick Plots and Basic Control Aesthetics Changing Plot Types Labels Themes and Layout |
dplyr R Functions Functions for Numeric Data Scoping Rules mutate arrange group by summarize select filter joining dataframe |
Module 4 : Presentation |
Module 5 : Data Cleaning |
Module 6 : Date Times |
|
rmarkdown Reproducible research Reporting Sharing results Repetitive Tasks Family of apply Functions apply Function lapply Function sapply Function tapply Function |
tidyr spread gather seperate unite Logical Data Missing Data Character Data Duplicate Values NA’s |
Time and Date Variables lubridate Setting a datetime Getting values from a datetime strftime Command strptime Command as.Date function Datetimes Calculations difftime Command Time Series Analysis |
Module 7 : Data Import |
Module 8 : Linear Models |
Module 8 : Non-Linear Models |
|
R Datasets Data.Frames Importing CSV Files Import from Text Files Import from Excel Import from Spss or SAS Connecting to a database Connecting to a cluster Databases and ODBC dbplyr |
What is a model? Statistical Models in R How to evaluate a model? How to use a model? Simple Linear Models logistic regression linear regression R squared p values confidence intervals |
Decision Trees random forest boosting overfitting Optional material : Interactive dashboards with Shiny Web Scraping Writing packages Spark Functional programming |
These companies already made use of our courses:
These companies used our courses: